

Dual Core Services
Trading Analytics
High-frequency data visualization for institutional-grade decision making. We map financial variance to galactic constellations, providing a visual syntax for market volatility. Strict grid lines, zero noise.
The Data-Candle
Visualizing the "Scent of Code" concept through glass vessels containing data wax. Click any vessel to expand the abstract.


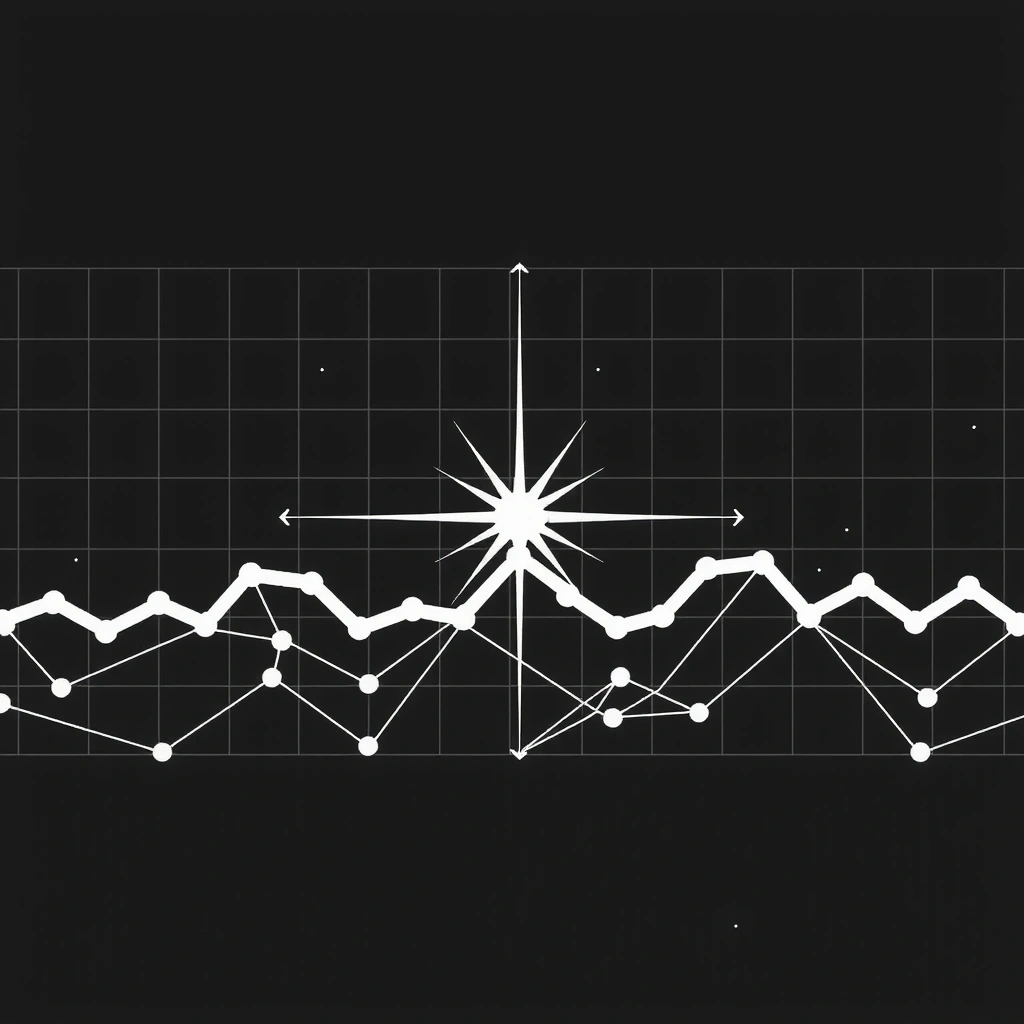
Star-Curve Graphing
Merging financial line graphs with celestial constellations. The axis represents time and gravity; data points are mapped as stellar nodes. Click to view the high-resolution vector layout.

lapatik.com Field Guide
Core Concept
Galactic Minimalism is not an art style; it is a constraint system. It dictates that every element must serve a functional purpose and that aesthetic value is derived strictly from mathematical precision. When we talk about the "Scent of Code," we refer to the invisible architecture that remains when visual decoration is stripped away.
Decision Criteria
- • Signal-to-Noise Ratio: If an element adds no informational value, it is deleted. No exceptions.
- • Grid Adherence: All content must map to an invisible 12-point grid. Diagonal alignment is forbidden.
- • Contrast Ratio: Minimum 4.5:1 for all text. Gray-on-gray is considered a system failure.
- • Typography: Sans-serif, uncompressed. We prefer the precision of Helvetica over the warmth of Serif.
Myth vs. Fact
Myth:
"Minimalism means boring."
Fact:
It means the removal of friction. Complexity is hidden, not absent.
Myth:
"You need gradients for depth."
Fact:
Depth is achieved through spacing, sizing, and high-contrast layering.
Mini-Glossary
- VARANCEUncertainty metric
- NODEData point
- CONSTRAINTCreative enabler
- NOISEDecorative waste
Common Mistakes
- Using low-contrast gray text for "sophistication" (unreadable).
- Overusing glassmorphism without checking contrast against backgrounds.
- Adding hover animations that obscure content (distraction).
- Failing to provide sufficient white space between grid elements.
How It Works
Define Constraints
Start by listing what is forbidden. Removing options forces creative solutions within the remaining space.
Select Approach
Choose the specific architecture (binary tree, mesh, linear) that best fits the data variance.
Apply Method
Execute the build with strict adherence to the grid. Do not deviate from the initial plan.
Review & Deploy
Test the signal output. If the system is readable and fast, it is ready for the galaxy.
Signals of Trust & Quality
Privacy First
Scenario: A client requested user tracking. We provided an anonymized heat map instead. Result: 100% data compliance without losing insights.
View Privacy Policy →Technical Support
Benchmark: Average response time for critical infrastructure tickets is 14 minutes. We do not use chatbots.
View Terms of Service →Age Verification
Standard: All financial data visualizations are restricted to verified accounts. Access requires valid ID.
Strict 18+ Policy EnforcedLAPATIK • South Bank 797, Edinburgh, United Kingdom
+44 7610522220 • info@lapatik.com • Mon-Fri: 9:00-18:00
Home